This example shows how to load content from another page. We will basically use jQuery and the load method. You will need some knowledge in jQuery und about selectors.
All maps from this plugin allow to execute a JavaScript code whenever a region, marker or text is clicked. You can define an individual click value for each of these map elements. This value is available in the JavaScript code and can be used to do certain actions. This will also be useful in this example.
The first step is to pick two random places. We will simply use Berlin and Paris. This is what we want to achieve: If we click on Berlin, we want to get the latest map example from this site. If we click on Paris, we want to get the current version of this plugin.
We can load both values from the frontpage of this site. We only have to find the right selector for jQuery. The latest map example can be found by "#example-section .map-box:first a". The current version can be found by using "#current-version".
The load method allows to get content from another page. We will use "url + selector" as a parameter for the load function. For example, for Paris we would have the parameter "http://meisterpixel.com/interactive-map-builder/ #current-version".
We can proceed and create our map now:
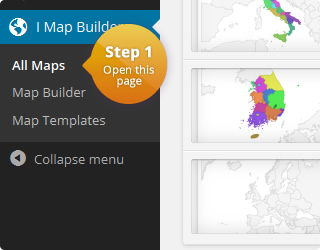
- We start with a new map. We select from the left admin menu I Map Builder Map Builder.
- We select a region where both markers fit in best. Therefore, we will pick “Western Europe”.
- In the display mode box we will select “Markers” and “Use coordinates”.
- We will now add the markers:
- We click on “Add marker”. A form should open.
- To find the correct coordinates, we will click on “Find coordinates” and search for Berlin.
- We pick a color, for example #445599.
- We set the click value for Berlin to
"http://meisterpixel.com/interactive-map-builder/ #example-section .map-box:first a". - Then we click on “Add”.
- We do the same for Paris by using the color #AABB00 and the click value
"http://meisterpixel.com/interactive-map-builder/ #current-version".
- We will have to pick a location around the map where we want to display our data when a marker is clicked. In this example, we will pick a location below the map. We have to extend the default HTML of the map. We click on “Map Template”. The box should expand and will allow us to add our custom HTML. We change it to:
<div id="{cssid}"> %%map%% <div id="data"> </div> </div> - The next step is to add our JavaScript code and the load method. We insert:
jQuery("#" + cssid + " #data").load(click_value);This will load the click value and will display the data in our#datadiv. - Since we won’t use tooltips in this example, we will simply disable them in the tooltip box (right column, last box).
- The last step is to click on “Save”.
The final map is the one from above. The map configuration can be seen here:
| Name | Value | Description |
|---|---|---|
| Region | Western Europe | List with all available regions |
| Width | auto | Width of the map in pixel. 'Auto' means that the map is centered in the available width. |
| Height | auto | Height of the map in pixel. 'Auto' means that the map is centered in the available height. |
| Display mode | Markers | Specifies the display mode of the map. |
| Border resolution | Countries | The resolution of the map borders. |
| Tooltips | Off | Allows to display a tooltip for highlighted map elements. |
| Tooltips: Trigger | none | The user interaction that causes the tooltip to be displayed. |
| Tooltips: Use HTML | Off | Specifies if the tooltips should use HTML. This allows to customize the tooltips even more. For example, if this property is on, it is possible to display images wihtin the tooltip. |
| CSS | #{cssid} circle {
cursor: pointer;
}
#{cssid} #data {
padding: 10px;
}
#{cssid} circle {
cursor: pointer;
} |
|
| HTML | <div id="{cssid}">
%%map%%
<div id="data">
</div>
</div> |
|
|
JavaScript Executed when a marker/region is clicked. Click value can be defined for each map element. |
jQuery("#" + cssid + " #data").load(click_value); |
|
| Color | Name | Click Value |
|---|---|---|
| Paris | http://meisterpixel.com/interactive-map-builder/ #current-version | |
| Berlin | http://meisterpixel.com/interactive-map-builder/ #example-section .map-box:first a |
Comments
If you need help or have questions, please leave a comment.