We hope the documentation provides help and answers to urgent questions. If you still need help, please don’t hesitate to write us.
Install
The installation procedure is similar to other plugins. This is the recommended way:- Download the zip file from CodeCanyon. You can find the link within your profile on the download page.
- Login to the admin panel of your WordPress site.
- Click on Plugins in the left menu.
- Click on Add New on top of the page.
- Click on Upload Plugin.
- Then there should be an input field to select a file from your computer. Pick the file that you downloaded in step 1. Then click on Install Now.
- This should start the install procedure.
- If there was no error, you should see a link to activate the plugin.
- A menu entry should appear on the left side and the plugin should be ready.
- Upload the folder
InteractiveMapBuilderto the/wp-content/plugins/directory. - Login to the admin panel of your WordPress site.
- Click on Plugins in the left menu. You should find the plugin on this site.
- Click on Activate.
- A menu entry should appear on the left side and the plugin should be ready.
If you have problems to install the plugin, contact us and we will try to provide the needed help.
Update
If you want to replace an older version by a newer one, we recommend to follow these steps:- Deactive the plugin. Don’t delete the plugin. Your maps will be lost otherwise.
- Download the zip file from CodeCanyon. You can find the link within your profile on the download page.
- Upload the folder
InteractiveMapBuilderto the/wp-content/plugins/directory. Make sure that you overwrite the old files. You can also delete the whole folder and then upload the folder from step 2. - Activate the plugin through the ‘Plugins’ menu in WordPress
Map Builder
The map builder is used to create and edit your maps. It can be subdivided into 4 main areas: map options, map preview, map elements and map template. Each section will be explained in more detail.1. Map Options
All available map options are located on the right side. The following picture gives an overview:
1.1 Regions
The region specifies the displayed area of the map and allows to focus the map on the world, a continent, subcontinent, country or a province. The default value is the world map. To focus the map on a smaller area, select a continent from the select field. After selecting, a new field should appear, showing a list of subcontinents. The selection of a subcontitent allows you to select a country. Note that the focus on states and provinces is only available for the United States.1.2 Resolutions
This option specifies the resolution of the map borders. The following values are available:- countries This is supported for all regions, except for US state regions.
- provinces This is supported only for country regions and US state regions. Not supported for all countries; if available, the option is selectable.
- metros – This is supported for the US country region and US state regions only.
- continents This is available for the world map and continent regions. It creates groups of continents.
- subcontinents This is available for the world map, continents and subcontinent regions. It creates groups of subcontinents.
Also note that the resolution might change automatically, if you select a region. Some resolutions are disabled, if they are not available.
1.3 Display Modes
The display mode specifies the data that you want to display. The following values are available:- If you want to create a map with text labels, then you have to select the text mode.
- If you want to highlight countries or provinces, then you have to select the region mode. For the United States, it is also possible to highlight metro areas. In this case, it is required to set the resolution (1.2) to metro borders.
- If you want to create a map with markers, then you have two choices:
- The first option allows to set the location by passing a string (for example, “1600 Pennsylvania Ave” or “New York City”). When the map is loaded, the string will be used to find the location of the marker. If you have many markers on the map, this can cause the markers to appear after a delay.
- In the coordinate mode, you can set the location by passing the latitude and longitude. The main advantage is that the markers appear when the map is loaded. So it is recommended to pick this mode. Even if you don’t know the coodinates, the form of the data table allows you to search for the coordinates.
1.4 Marker/Text Styling
If the map displays markers or text labels, the following options are available for the styling:- Marker/Font size This defines the size for all markers or text labels.
- Marker/Font opacity This specifies the opacity of all markers or text labels.
1.5 Map Styling
The following options are available:- background color The background color for the main area of the map.
- dataless region color Colors to assign to regions with no associated data.
- height The height of the map. The default height is 250 pixels, unless the width option is specified and keep aspect ratio is selected – in which case the height is calculated accordingly when the map is loaded.
- width The width of the map. The default width is auto. In this case, the map will automatically resize and fit to the content arround it.
- keep aspect ratio If selected, the map will have its natural aspect ratio. If not, the map will stretch.
- region interactivity If selected, a region can be selected and can react to clicks. Note that this option has to be selected to execute a click action.
- border size Specifies a border size arround the map. Default is 0. Better results can often be achieved by creating a dummy click action and specify the css there.
- border color Specifies the border color.
1.6 Tooltip Styling
The following options are available:- Show tooltips If selected, this will show tooltips.
- Trigger The user interaction that causes the tooltip to be displayed. The following values are available:
- Hover The tooltip will be displayed when the user hovers over an element.
- Click The tooltip will be displayed when the user clicks on an element.
- Use HTML If checked, it will allow to use HTML in the tooltips.
- Font color This specifies the font color for all tooltips. This option will be disabled, if you are using HTML tooltips. You can use the CSS of the map template to style the HTML content of the tooltips.
- Font name This specifies the font name for all tooltips. This option will be disabled, if you are using HTML tooltips. You can use the CSS of the map template to style the HTML content of the tooltips.
- Font size This specifies the font size for all tooltips. This option will be disabled, if you are using HTML tooltips. You can use the CSS of the map template to style the HTML content of the tooltips.
2. Map Preview
The preview renders the map for the given data and options. It updates automatically when an option or the data table changes. The following picture shows the preview area: The following options can be set for the preview area:
- Preview width This simulates different page sizes.
- Preview click This defines what happens when you click on something in the preview. You have two options that can independently be enabled or disabled: The first one controls the execution of the click action. The second one controls the opening of the data table form. Note that the opening for regions only works if the region interactivity is activated.
3. Map Elements
The data table contains all data that should be displayed in the map. The appearance of the data table might change with the selected display mode from the Map Options (2.1).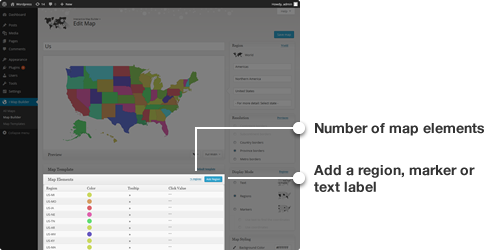 To edit an entry from the table, you have to click on the row. A form should appear and should look like this:
 You can edit the following values:
- Location Sets location for the given region or marker. Depending on the selected display mode, the field might look different.
- Color Sets a color for the region or marker.
- Tooltip Sets the title and text for the tooltip. Note that the Show tooltips option must be activated. Otherwise the tooltip will not be visible.
- Click Value Sets the click value for the region or marker. The expected value depends on the selected click action. To get more details, click on “All Click Actions” in the left menu and read the description of the click value. A closer look at at the values from the sample data table might also help.
4. Map Template
Map templates allow to add custom HTML, CSS and JavaScript to your map. The plugin renders maps like this: You will insert a given map somewhere on your site by using the corresponding shortcode. This shortcode will be replaced by the HTML from the map template. The CSS allows to add a custom styling to the HTML elements. If HTML tooltips are enabled, the CSS can also be used to style the content. JavaScript is used to capture click events from map elements. Each map element can have their own click value which is available when the JavaScript code is executed. This allows to add special behavior to your map, i.e. display text or HTML below the map.Map Templates
The plugin renders maps like this: You will insert a given map somewhere on your site by using the corresponding shortcode. This shortcode will be replaced by the HTML from the map template. The CSS allows to add a custom styling to the HTML elements. If HTML tooltips are enabled, the CSS can also be used to style the content. JavaScript is used to capture click events from map elements. Each map element can have their own click value which is available when the JavaScript code is executed. This allows to add special behavior to your map, i.e. display text or HTML below the map. The easiest way to learn more about map templates is to look at some of the map examples. The Map Template page allow to edit or create templates. The following picture shows a screenshot: The map template page is divided into 3 areas:
- List of Templates The list is found on the left side. A click on the name loads the example map and the description.
- An example map The map demonstrates what the click action does. This map is the same for all templates: It shows Germany, Spain and Italy. The only difference is the specified click value for each country. The data table is hidden by default and can be displayed by clicking on “Show data table”.
- Description This is located below the map and should describe what click actions does and what click values it is expecting.
Editing
To edit a template, you find the link “Edit” on top of the map example. The page will then switch to editing mode: Besides the name and the description, there are four important values to edit.
1. Data table & Example click values
There are three predefined countries for the example map: Germany, Spain and Italy. For each country, the click value can be edited. Note that these are the values that will be passed to the JavaScript when the region or marker is clicked.2. Javascript
The JavaScript code allows to add special behavior to the map. This can depend on the given click value. Besides the click value, there are also predefined variables for your JavaScript code. These are:// Available Variables
var click_value; // Click Value of the clicked region or marker.
var i; // The row number in the Data Table.
var click_values; // All other Click Values. click_values[i]=click_value
var cssid; // The generated value of the {cssid} placeholder in the HTML and CSS.
var storage; // Storage specifically for the clicked region/marker. Keeps the value until the next click. Initial value is null.
var map_storage; // Storage available to all clicked regions/markers. Keeps the value until the next click. Initial value is null.
var jQuery, $; // jQuery library. Version depends on the installed WordPress version.
//...(your own code)...
Whenever a region, marker or text label is clicked, the JavaScript code will be executed.
3. HTML
You can add your own HTML to the template. This can be useful, if you want to display data somewhere around the map. There are two placeholder available for the HTML:- {cssid}: This will be replaced by an id when the map is rendered. For example, you could write:
<div id="{cssid}">

</div>
This ensures that you don’t conflict with other maps. The JavaScript from above offers a variable named “cssid” to find element:jQuery("#" + cssid); - %%map%%: The second placeholder is required to be inserted somewhere in your HTML. This will be replaced by the generated HTML of the map. The default value of the HTML is the following:
<div id="{cssid}">
   %%map%%
</div>
3. CSS
The CSS has one placeholder:- {cssid}: This will also be replaced with the generated id. The default CSS is:
#{cssid} {

}
Debuging
Before saving, you can test the changes by clicking on “Update Preview”. This reloads the example with the new data. A message box will appear, if there are errors in your JavaScript code.Import
1. Import maps
Navigate to the “All Maps” page and hit the button “Import” at the top of the page. The map can be importet in two ways:- File mode: Upload a file that contains the map. The file must be generated with the plugin.
- Text mode: Paste text into the text field. This allows to copy maps from one place to another using the clipboard. Note that the text has to be generated from the plugin.
2. Import a map template
The Text mode is the only import method available for templates. To import a template, navigate to the map template page and hit the “Import” at the top. Insert the text and click on the “Import” button. The template should automatically be inserted to the left menu.3. Import maps and templates together
This only applies to maps that are using saved templates – so all templates that are not the “default template” and not the “custom template”. If you want to import a map, you have to be aware that only the map is imported and not the selected template. If you want to import both, we recommend to follow these steps:- Import the template.
- Import the map. Then select the imported template in the Map Builder. Before saving you can already test in the preview, if everthing works as supposed.
Export
3.1 Export a map
To export a map, navigate to the “All Maps” page, hit the button “More” and select export. Then you can either export a file or text. If the map is not using the “default template” or “custom template”, please note that the selected template won’t be exported and needs to be exported seperately.3.2 Export a map template
To export a template, navigate to the map template page and make sure that the template is selected. Then hit the “Export” button above the map.Other technical aspects
1. Change the visibility of the plugin for (admin) users
The visibility is controled by the capabilities that a user has. This is what WordPress.org says about capabilities:WordPress uses a concept of Roles, designed to give the site owner the ability to control what users can and cannot do within the site.The plugin is only visible to users that have the capability “install_plugins”. This means that only “Super Admin” and “Administrator (single site)” users will be able to see the plugin. “Administrator (multisite)”, “Editor”, “Author”, “Contributor” and “Subscriber” won’t see the plugin in their admin panel. If you are using a multisite or if you want to enable other users to see the plugin, you can use the following filter function. Add this line to the “functions.php” of your theme (There are probably also other places to add this line of code. You only have to make sure that the filter exists, when the plugin code is executed):
add_filter( 'imap_builder_capability', function( ) { return 'activate_plugins'; } );
This will set the needed capability to “activate_plugins”.
There is also another way to set the capability. In the Interactive Map Builder folder should be a file named class-interactive-map-builder.php. You will have to search for the following lines:
public function add_plugin_admin_menu() {
   $capability = apply_filters( 'imap_builder_capability', 'install_plugins');
   // (...)
}
There you can change the value ‘install_plugins’ to something else, like ‘activate_plugins’. If you save the file now, this method should have the same effect like the filter from above. However, we recommend to use the filter method. This will leave the plugin code untouched and you won’t have to edit anything, if you update the plugin in the future.
2. Change the shortcode
The shortcode is used to insert a map somewhere on your site. The default shortcode is [interactive_map id=”1″]. If you want to change the shortcode, you will have to open the file namedclass-interactive-map-builder.php. You will find this file in the Interactive Map Builder folder. Open this file and search for the following lines:
// Add shortcode
add_shortcode( 'interactive_map', array($this, 'shortcode_function') );
If you change ‘interactive_map’ to ‘imap’, you will be able to include the maps by using [imap id=”1″].
3. Credits
We want to acknowledge some of the used resources.- Google GeoChart API: Our plugin uses this API to generate the maps. This API is also used for other Google products like Analytics.
- CodeMirror: A text editor written in JavaScript. It is used to enable syntax highlighting for the HTML, CSS and JavaScript in the map templates.
- WordPress Plugin Boilerplate: This great code was used as a foundation for our plugin.
- Font Awesome: We used the icons of this font in our plugin and on this site.
Help tabs
The documentation is also included to the plugin. You can access this on every plugin page by clicking on the help button.