This is an interactive map of France, Spain and Portugal:
Check out the version without islands.
If you pick the region Southern Europe, you will see all surrounding countries of France, Spain and Portugal. To hide all of them, you will need an additional CSS rule. If you want to add it to an existing map, then follow these steps:
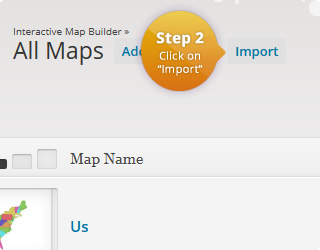
- Open your map in the map builder. (If you want to create a new map, you can simply skip all the steps and use the download button from below.)
- Make sure that in the right column the region is set to “Southern Europe”. Otherwise, this method won’t work.
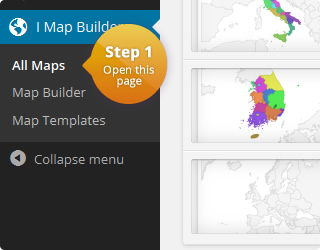
- Click on “Map Template”.
- Append the following CSS to your existing styles:
#{cssid} svg g:nth-child(1) > g:nth-child(1) > path { display: none; } #{cssid} svg g:nth-child(1) > g:nth-child(1) > path:nth-child(n+5):nth-child(-n+16), #{cssid} svg g:nth-child(1) > g:nth-child(1) > path:nth-child(n+120):nth-child(-n+131), #{cssid} svg g:nth-child(1) > g:nth-child(1) > path:nth-child(n+246):nth-child(-n+253) { display: block; } - Click on “Update Preview” to see the changes.
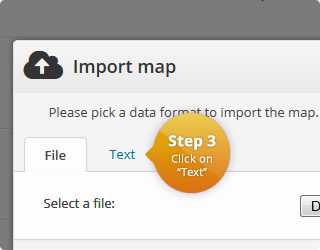
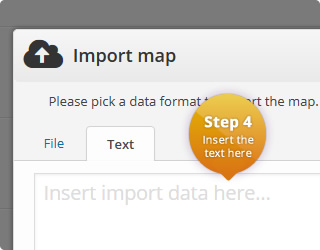
This will manually hide all elements within the SVG graphic that belong to the other countries. If you haven’t created a map yet, you skip the steps from above and import the following:
Map settings
| Name | Value | Description |
|---|---|---|
| Region | Southern Europe | List with all available regions |
| Width | auto | Width of the map in pixel. 'Auto' means that the map is centered in the available width. |
| Height | auto | Height of the map in pixel. 'Auto' means that the map is centered in the available height. |
| Display mode | Markers | Specifies the display mode of the map. |
| Border resolution | Countries | The resolution of the map borders. |
| Tooltips | On | Allows to display a tooltip for highlighted map elements. |
| Tooltips: Trigger | focus | The user interaction that causes the tooltip to be displayed. |
| Tooltips: Use HTML | Off | Specifies if the tooltips should use HTML. This allows to customize the tooltips even more. For example, if this property is on, it is possible to display images wihtin the tooltip. |
Map template
| CSS | #{cssid} svg g:nth-child(1) > g:nth-child(1) > path {
display: none;
}
#{cssid} svg g:nth-child(1) > g:nth-child(1) > path:nth-child(n+5):nth-child(-n+16),
#{cssid} svg g:nth-child(1) > g:nth-child(1) > path:nth-child(n+120):nth-child(-n+131),
#{cssid} svg g:nth-child(1) > g:nth-child(1) > path:nth-child(n+246):nth-child(-n+253) {
display: block;
} |
|
| HTML | <div id="{cssid}">
%%map%%
</div> |
|
|
JavaScript Executed when a marker/region is clicked. Click value can be defined for each map element. |
||
Map elements (3)
| Color | Name | Click Value |
|---|---|---|
| Madrid | ||
| Paris | ||
| Gran Canaria |
Comments
If you need help or have questions, please leave a comment.